
While much of the Hurricane Ian recovery is focused on land, our partners at NOAA have been collecting data about what happened with the water, and assessing safety of the waterways. They have produced two story maps to share the results of these efforts. You can think of story maps as a slide show connected to a map. Kudos to NOAA and their network of partners including the US Coast Guard and US Army Corps of Engineers for doing this important work.
"Extreme Water Levels During Hurricane Ian" describes the path of the Hurricane and the resulting record high and low water levels across the state. NOAA’s Center for Operational Oceanographic Products and Services (CO-OPS) tracked water levels during the storm in real-time through the CO-OPS’ Coastal Inundation Dashboard. CO-OPS’ network of water level stations along the coast captured significant water levels at many locations, providing insight into the devastating impacts that Hurricane Ian had on the communities in its path.
"Hurricane Ian Response 2022" depicts the work of NOAA’s navigation response teams (NRT). These teams worked in coordination with the US Coast Guard and the US Army Corps of Engineers to determine if several waterways were safe for use following the hurricane. They conducted five surveys - two in the Tampa Bay area, one in Fort Myers, one in Capri Pass near Naples, and over the Franklin Lock and Dam.

Introducing a new segment: Member Spotlight. Here, we highlight the organizations and individuals part of the Innovation District.

Proxflyer brings additional expertise in autonomous maritime systems that strengthens our growing defense and maritime innovation community
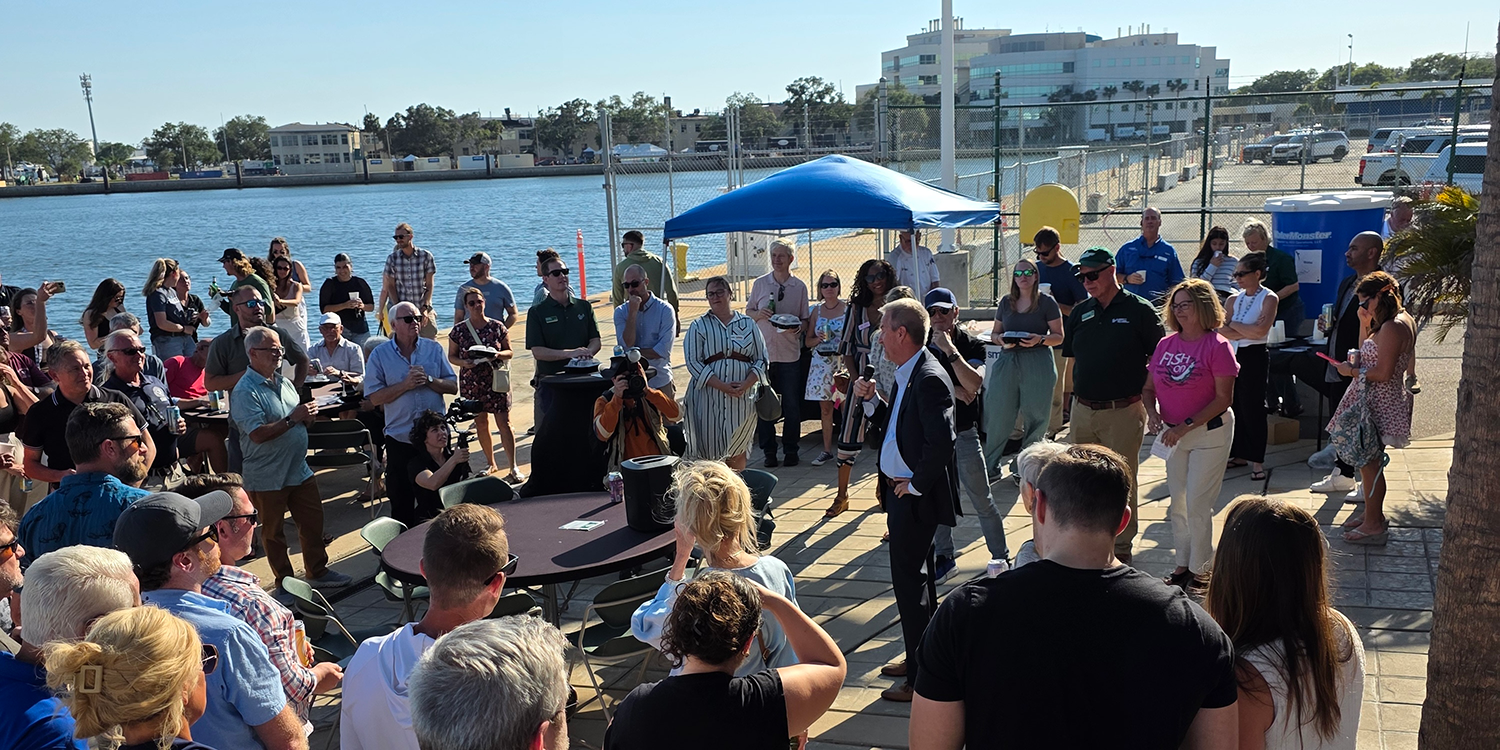
The response to the recent fire at the University of South Florida College of Marine Science has been a testament to the strength of St. Petersburg.